The sampling distribution for the sample mean tends in the limit of
large to
. Therefore, the
pivotal quantity or test statistic is distributed as
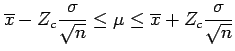
. The
confidence interval for can be
written
(5.1)
where
is the the half-width
of the
confidence interval measured in
standard errors. is sometimes referred to as a
critical value. Table 4.1 gives some critical values
for various confidence limits:
Table:
Critical values for various common confidence levels