
Critical Strip Explorer (version 0.67)
This applet has been developed by Raymond Manzoni, based on my suggestions. It is still very much under development. New features and improvements will be added in due course, and there may still be bugs to be removed.
Clicking and dragging with your mouse on the blue field, you are able to explore the behaviour of the Riemann zeta function in the complex plane. The origin always appears in the centre of the screen, but by using the upper-horizontal sliding controller, you can zoom in or out to view a larger or smaller section of the plane.
The lower-horizontal and right-vertical sliding controllers can be used to change the x- and y-offsets. These determine a translation relating the points you click on to the actual values input as arguments of zeta. You can thus use them to explore zeta(s) for s far removed from the visible part of the complex plane. The actual values displayed of course tell you which value of s you select by clicking on the origin. Also, by sliding these controls, you are able to effectively slide your point s horizontally or vertically from its last input value.
If you reset to the default value (s = 1/2 + i14.1347251..., the 'first' nontrivial zero), and then use the right-vertical controller, you can watch what happens at various points on the critical line Re[s]=1/2. The upper-horizontal controller can be used to zoom out and get a wider perspective. The motion of the polygonal line is not very smooth, you may find, but this can be adjusted with the left-vertical contoller (output scaling). Moving this up produces a more gradual, smooth motion.
Constraining the value of x to be Re[s] = 1/2 will allow you to explore the behaviour of zeta on the critical line, and (in theory) to manually "find" nontrivial zeros on the critical line. As well as the x and y constraints, there are also the possibilities of constraining the phase and the modulus of z, in order to explore the behaviour of zeta along rays and around circles centred at the origin.
The vertices of the polygonal line which you see correspond to the partial sums (or products) in an infinite sum (or product) expression for the zeta function. There are a number of options in the lower-left combobox (not currently visible in the IE browser):
- Finite zeta sum is the most familiar expression for zeta(s),
converging for Re[s] > 1. Obviously we can only approximate the
infinite sum with a finite number of terms. This is the case for all options, but you
are free to choose the number of terms ("number of points").
- Mirror zeta sum combines the functional equation
with the usual sum to produce an expression which converges for Re[s] < 0.
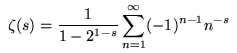
- Alternate zeta sum makes use of a well-known technique for
extending the usual sum into the critical strip (i.e. values of
zeta(s) where Re[s] > 0) involving a sum whose terms have
alternating signs:

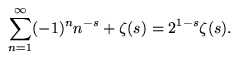
- Mirror alternate sum combines the functional equation with the
"alternate zeta sum" in order to produce an expression which converges
when Re[s] < 1.
- Finite Euler product is based on the usual product-over-primes
form of zeta, also convergent when Re[s] > 1.
- Documentation on the Riemann-Siegel function and Riemann-zeta
function options will appear shortly.
- Riemann zeta 3-D aims to introduce 'perspective' to produce a 3-dimensional effect. This is still under development.
Hence, with each of the first five options, the polygonal line "spirals in" on the value of the zeta function at the selected s = x + iy.
It is very interesting to experiment with the vertical scaling and see what happens in higher regions of the critical strip.
Raymond's recommendations for newcomers:
- select the kind of sum, product or function you want to see in the combobox
- use the up and down arrows of the scrollbar at the right (not the other parts which scroll "too fast") to scroll the picture
Glen Pugh has produced a couple of related applets: a "Dirichlet Series Animation" depicting "wandering partial sums" and one which plots the behaviour of zeta along the critical line. Jan van Delden has produced another applet based on Pugh's.